3D Statistical Parametric Mapping of quiet sleep EEG in the first year of life
Filed under:
Neuroimaging
Pedro A. Valdes-Sosa (Cuban Neuroscience Center), Jorge Bosch-Bayard (Cuban Neurosceince Center)
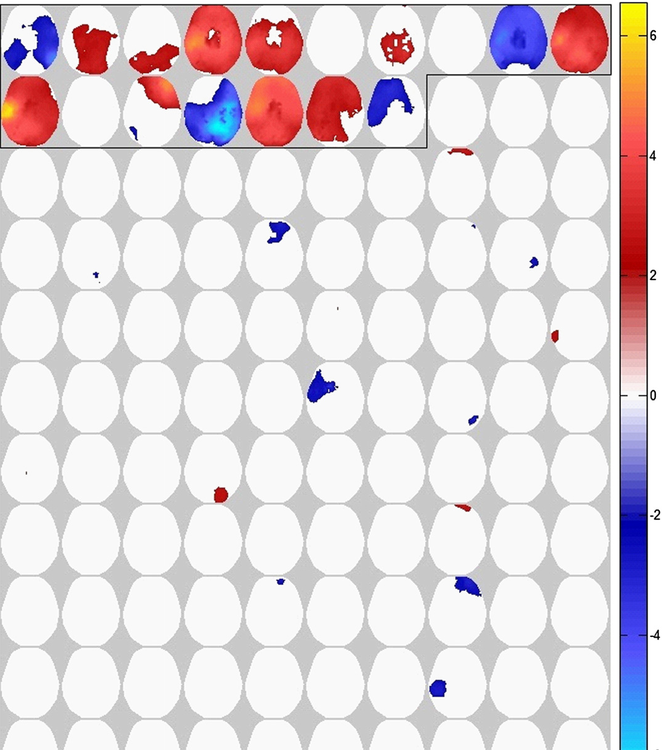
This work extends previously developed 3D SPM for Electrophysiological Source Imaging (Bosch et al., 2001) for neonate EEG. It builds on a prior paper by our group that established age dependent means and standard deviations for the scalp EEG Broad Band Spectral Parameters of children in the first year of life. We now present developmental equations for the narrow band log spectral power of EEG sources, obtained from a sample of 93 normal neonates from age 1 to 10months in quiet sleep. The main finding from these regressions is that EEG power from 0.78 to 7.5Hz decreases with age and also for 45-50Hz. By contrast, there is an increase with age in the frequency band of 19-32Hz localized to parietal, temporal and occipital areas. Deviations from the norm were analyzed for normal neonates and 17 with brain damage. The diagnostic accuracy (measured by the area under the ROC curve) of EEG source SPM is 0.80, 0.69 for average reference scalp EEG SPM, and 0.48 for Laplacian EEG SPM. This superior performance of 3D SPM over scalp qEEG suggests that it might be a promising approach for the evaluation of brain damage in the first year of life.
References
Hernandez-Gonzalez, G., Bringas-Vega, M. L., Galan-García, L., Bosch-bayard, J., Melie-garcia, Y. L.-ceballos L., Valdes-Urrutia, L., Cobas-Ruiz, M., et al. (2011). Multimodal Quantitative Neuroimaging Databases and Methods: the Cuban Human Brain Mapping Project. Clinical Eeg and Neuroscience, 42(3), 1-11.
Bosch-Bayard, J., Valdés-Sosa, P. a, Fernandez, T., Otero, G., Rivero, B. P., Ricardo-Garcell, J., González-Frankenberger, B., et al. (2011). 3D Statistical Parametric Mapping of quiet sleep EEG in the first year of life. NeuroImage. http://dx.doi.org/doi:10.1016/j.neuroimage.2011.11.001

Preferred presentation format:
Poster
Topic:
Neuroimaging

 Latest news for Neuroinformatics 2011
 Follow INCF on Twitter
