PCA-VisData - a new Evaluation and Visualization Tool Using the Database RodImAnD for Analysis of Rodents Brain Function in Drug Research
Filed under:
General neuroinformatics
Laura Cristina Konerth (Instit. of Pharmacology, FAU Erlangen-Nuremberg), Andreas Hess (Instit. of Pharmacology, FAU Erlangen-Nuremberg, INCF: Digital Atlasing Infrastructure Task Force)
Purpose:
Functional brain imaging by MRI (fMRI) allows repetitive, non-invasive measurements of CNS functions. By combining it with mouse genomics, which provides mice with defined genetic deviations, gene-drug-interactions can be investigated. The huge amount of functional MR data can be administrated by the in-house developed relational database RodImAnD (Rodents Imaging and Analyses Database, L. Konerth, INCF, 2010), which permits the structured organization as well as a dynamic and interactive access to the data. To reduce the complexity of the data and to perform higher order statistical analysis with minimal interaction and calculation periods, we aimed at developing a software tool, which permits: (1) interactive access to the data stored in the database, (2) higher order statistical evaluation, starting with a Principal Component Analysis (PCA) and (3) the graphical 2D- or 3D- representation of the results.
Method:
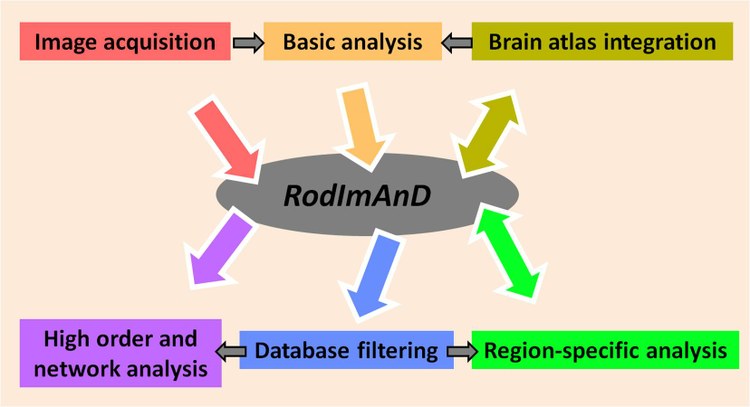
Our database RodImAnD uses the relational MySQL database management system. Its scheme reflects the workflow of our functional experiments (fig. 1). Both the major image analysis tool used in our working group, MagnAn, and our new developed evaluation and visualization tool, PCA-VisData, are based on IDL (® Exelis VIS), a high-level development environment for data analysis and visualization. Data exchange from the database to both analysis tools is made possible through a Java-based bridge. After the interactive selection of initial data (the time profiles of chosen brain structures), and the calculation of the average response parameters for the selected group of animals, the interactive sorting of the calculated data in variables and groups is made and the Principal Component Analysis (PCA) is performed. The obtained results can then be visualized in 2D- or 3D-graphics, as chosen by the user.
Results:
We obtained a new evaluation and visualization tool which permits the interactive data selection from the database, allowing for more efficient data reading and much faster processing. By performing PCA, as a first step, it reduces the data dimensions and represents the data graphically along the principal axes defined by the eigenvectors. This allows for highlighting the similarities and differences within selected study-groups.
Conclusion:
The presented tool allows for easy integration of databases with interactive high level statistical analysis of brain function and supports data sharing/collaboration with other users.

Preferred presentation format:
Poster
Topic:
General neuroinformatics

 Latest news for Neuroinformatics 2011
 Follow INCF on Twitter
